Kube-Prometheus监控主机和中间件(一)
一、背景简介
随着业务向云原生架构迁移,原有的监控系统需要升级以适应容器化环境。本系列文章介绍如何使用 Kube-Prometheus 监控 K8s 集群外部的主机和中间件服务。
核心特点:
- 支持监控 K8s 集群外部的服务(MySQL、Redis、RocketMQ 等)
- 通过环境标签(platform)区分不同环境的监控数据
- 基于 Prometheus Operator 的 ServiceMonitor 机制实现服务发现
二、技术原理
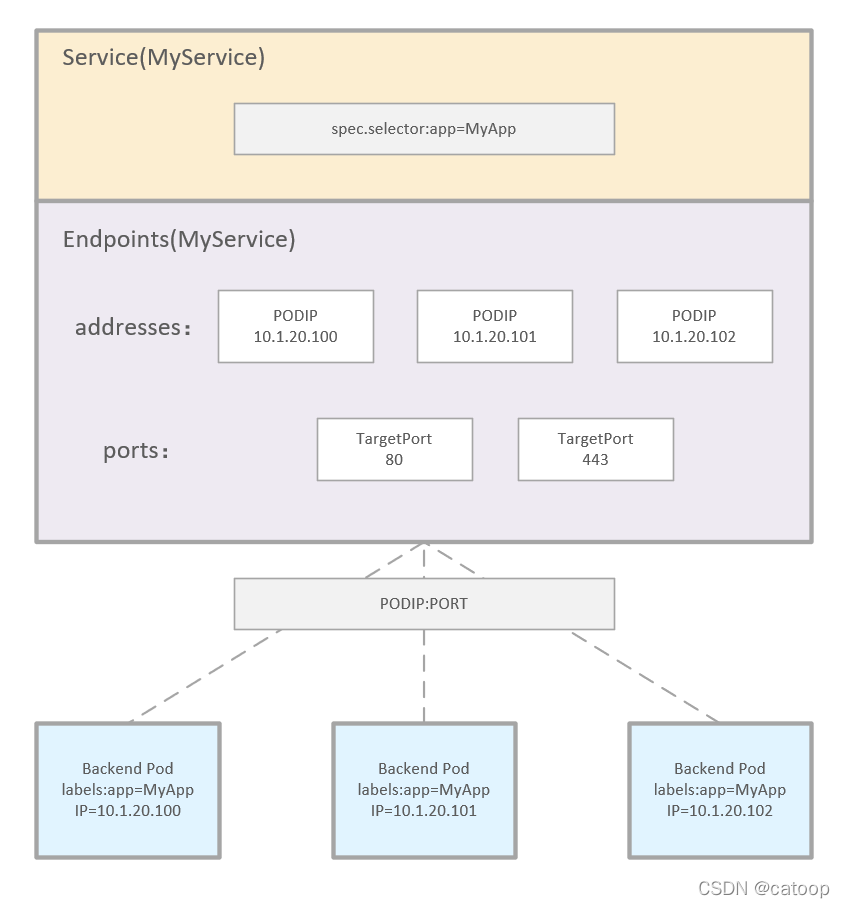
2.1 K8s 访问外部服务
K8s 集群内的 Pod 访问外部服务的原理:
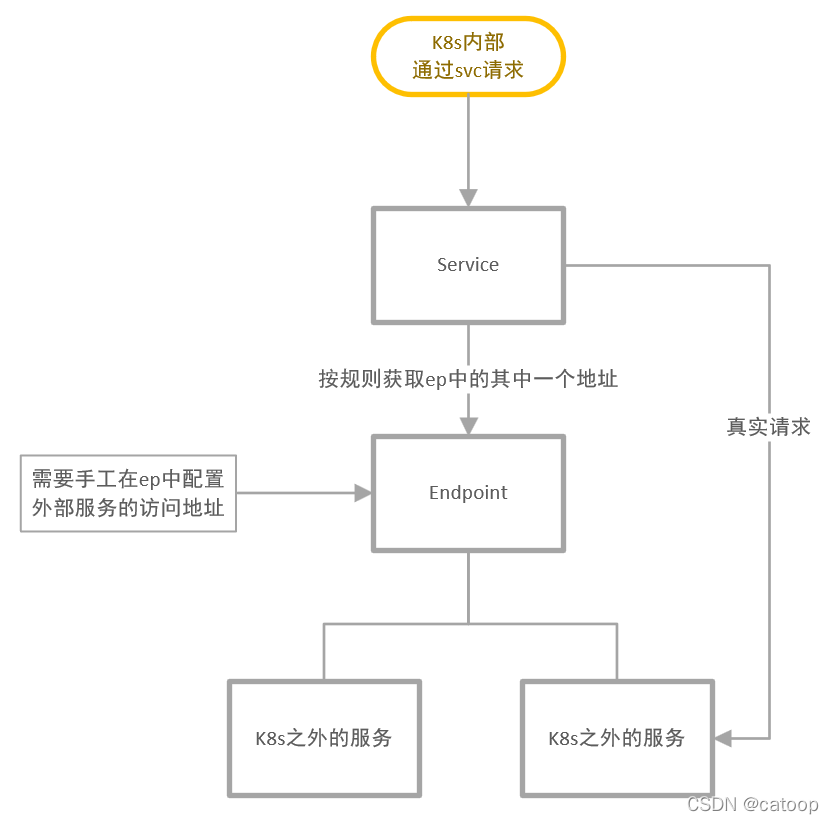
关键步骤:
- 创建 Endpoints 资源,指向外部服务的 IP 地址
- 创建 Service 资源,不配置 selector,关联到手动创建的 Endpoints
- Pod 通过 Service 名称访问外部服务
2.2 ServiceMonitor 原理
Prometheus Operator 通过 ServiceMonitor 实现服务发现:
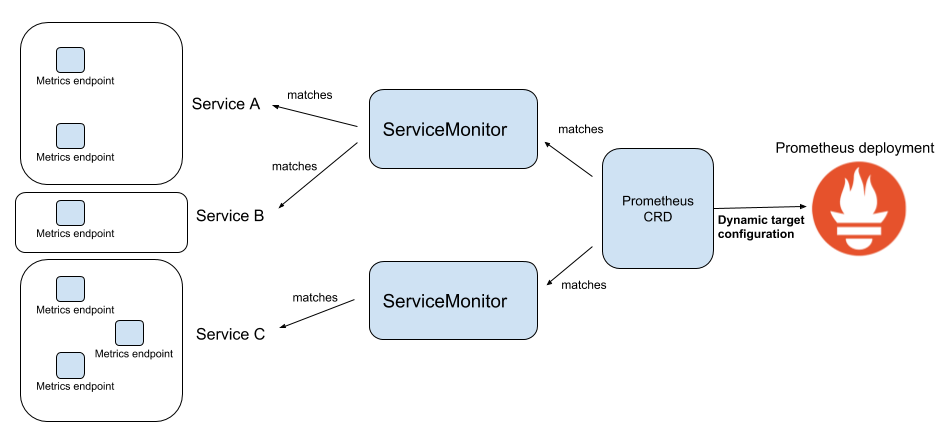
工作流程:
- ServiceMonitor 通过 selector 选择目标 Service
- Prometheus Operator 监听 ServiceMonitor 变化,更新 Prometheus 配置
- Prometheus 根据配置发现 Endpoints,采集指标数据
三、环境准备
3.1 创建命名空间
kubectl create namespace monitoring
# 执行结果:namespace/monitoring created
配置角色和权限
monitoring-role.yaml
apiVersion: rbac.authorization.k8s.io/v1
kind: Role
metadata:
  name: prometheus-k8s
  namespace: mos-monitoring
rules:
  - apiGroups: [""]
    resources:
      - services
      - endpoints
      - pods
    verbs:
      - get
      - list
      - watch
  - apiGroups:
      - extensions
    resources:
      - ingresses
    verbs:
      - get
      - list
      - watch
monitoring-role-binding.yaml
apiVersion: rbac.authorization.k8s.io/v1
kind: RoleBinding
metadata:
  name: prometheus-k8s
  namespace: mos-monitoring
roleRef:
  apiGroup: rbac.authorization.k8s.io
  kind: Role
  name: prometheus-k8s
subjects:
  - kind: ServiceAccount
    name: prometheus-k8s
    namespace: monitoring
配置说明:
- Role 定义了 Prometheus 在业务命名空间中的访问权限
- RoleBinding 将 Role 绑定到 Prometheus 的 ServiceAccount
四、监控实施
环境隔离方案:
为了区分不同环境的监控数据,在 Service 中添加自定义标签 platform: <env>,通过 ServiceMonitor 的 targetLabels 配置将该标签添加到指标中。
后续章节内容:
五、注意事项
- 网络连通性:确保 K8s 集群能够访问外部服务的网络和端口
- 权限配置:每个业务命名空间都需要配置 Role 和 RoleBinding
- 标签统一:保持所有监控组件的标签一致性,方便管理和查询
- 环境区分:通过
platform标签区分开发、测试、生产环境
本博客所有文章除特别声明外,均采用 CC BY-NC-SA 4.0 许可协议。转载请注明来源 逐光の博客!
相关推荐

2023-05-08
Kube-Prometheus监控RocketMQ(四)
一、概述本文介绍如何使用 Kube-Prometheus 监控 RocketMQ。通过部署 RocketMQ Exporter,将 RocketMQ 的消息队列指标暴露给 Prometheus 进行采集和监控。 核心组件: RocketMQ Exporter:用于暴露 RocketMQ 指标的 Exporter ServiceMonitor:Prometheus Operator 的 CRD,用于服务发现和指标采集配置 二、部署 RocketMQ Exporter2.1 创建 Deployment通过 Deployment 部署 RocketMQ Exporter,需要配置 NameServer 地址。 apiVersion: apps/v1 kind: Deployment metadata: labels: app.kubernetes.io/component: exporter app.kubernetes.io/name: rocketmq-exporter app.kubernetes.io/part-of: kube-prometheus ...

2023-05-07
Kube-Prometheus监控Redis(三)
一、概述本文介绍如何使用 Kube-Prometheus 监控 Redis。通过部署 Redis Exporter,将 Redis 的性能指标暴露给 Prometheus 进行采集和监控。 核心组件: Redis Exporter:用于暴露 Redis 指标的 Exporter(镜像版本:v1.37.0) ServiceMonitor:Prometheus Operator 的 CRD,用于服务发现和指标采集配置 二、部署 Redis Exporter2.1 创建 Deployment通过 Deployment 部署 Redis Exporter,需要配置 Redis 连接信息。 apiVersion: apps/v1 kind: Deployment metadata: #设置唯一名称,建议添加数据库实例ip name: redis-exporter-172.16.1.77 namespace: monitoring labels: app.kubernetes.io/component: exporter app.kubernetes.i...

2023-05-06
Kube-Prometheus监控MySQL(二)
一、概述本文介绍如何使用 Kube-Prometheus 监控 MySQL 数据库。通过部署 MySQL Exporter,将 MySQL 的性能指标暴露给 Prometheus 进行采集和监控。 核心组件: MySQL Exporter:用于暴露 MySQL 指标的 Exporter(镜像版本:v0.14.0) ServiceMonitor:Prometheus Operator 的 CRD,用于服务发现和指标采集配置 二、部署 MySQL Exporter2.1 创建 Deployment通过 Deployment 部署 MySQL Exporter,需要配置数据库连接信息。 apiVersion: apps/v1 kind: Deployment metadata: #设置唯一名称,建议添加数据库实例ip name: mysql-exporter-172.16.1.77 namespace: monitoring labels: app.kubernetes.io/component: exporter app.kubernetes....

2023-05-09
Kube-Prometheus监控Nacos(五)
一、概述本文介绍如何使用 Kube-Prometheus 监控 Nacos 服务。Nacos 自带 Prometheus 指标接口,无需额外部署 Exporter,只需通过 Endpoint 和 ServiceMonitor 配置即可实现监控。 监控方式: Nacos 内置了 Micrometer 指标,通过 /nacos/actuator/prometheus 接口暴露 使用 Endpoints 手动指定 Nacos 集群节点 IP 通过 ServiceMonitor 配置 Prometheus 采集规则 二、配置部署2.1 创建 Endpoints由于 Nacos 通常部署在 K8s 集群外部,需要手动创建 Endpoints 指向 Nacos 服务器。 apiVersion: v1 kind: Endpoints metadata: name: nacos-exporter namespace: monitoring subsets: - addresses: - ip: # 列举 nacos 的机器的ip1 - ip: # 列举 nacos 的机器的i...

2023-11-15
k8s容器部署时区问题处理
一、问题描述在 K8s 环境下部署应用后,发现数据库中记录的时间比北京时间晚了 8 小时,导致按时间查询数据时无法查到正确结果。这是典型的时区不一致问题。 涩及的时区配置点: MySQL 数据库服务器的时区设置 MySQL 数据库时区配置 JDBC 数据库连接的时区配置 应用服务器时区配置 应用容器的时区配置 二、问题排查2.1 服务器时区检查首先确认各个服务器的时区,使用命令 date 或 date -R。 [root@host-172 ~]$ date 2023年 11月 15日 星期三 21:19:02 CST [root@host-172 ~]$ date -R Wed, 15 Nov 2023 21:19:06 +0800 结果显示服务器时区为 CST(东八区)。 2.2 数据库时区检查在确认服务器时区后,进一步确认数据库的时区,在数据库执行下面命令: show variables like '%time_zone%' 查询结果如下: variable_name value system_time_zone CST time_zone SYSTEM...
2024-12-30
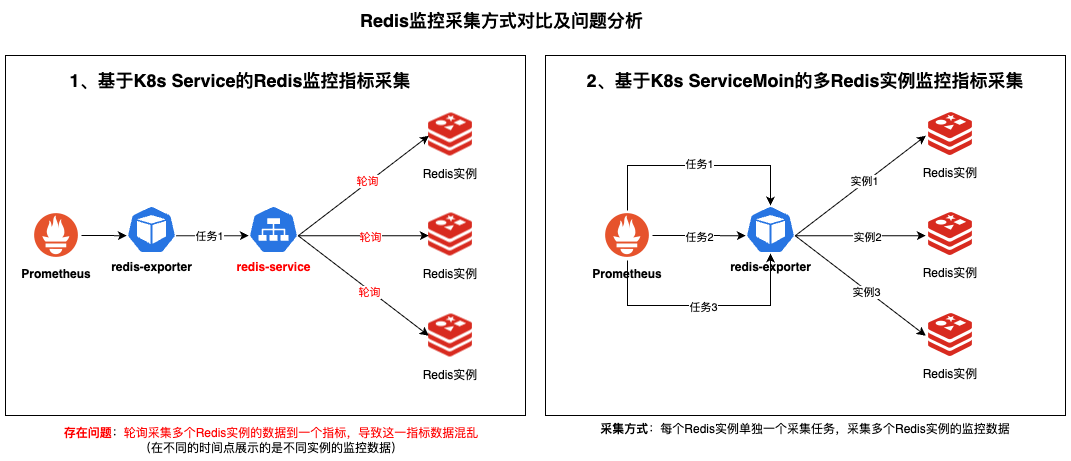
Redis集群监控配置-Helm部署方案
一、背景简介生产环境的Redis监控告警一直存在准确性问题,通过深入排查发现redis-exporter采集方式不正确,导致监控指标偏差和告警误报。为了解决这些问题,采用标准化的Helm部署方式来实现Redis集群监控采集。 核心解决问题: 修复Redis监控指标采集不准确的问题 统一Redis集群监控部署方式 提供安全的认证信息管理 支持多集群的灵活配置管理 本方案通过Helm部署redis-exporter实现Redis集群监控采集,确保监控数据的准确性和可靠性。 二、部署文件准备2.1. 必需文件清单 文件类型 文件名称 说明 Helm Charts prometheus-redis-exporter-6.9.0.tgz prometheus-redis-exporter chart部署包 配置文件 redis-exporter-values.yaml redis-exporter配置文件 版本说明: 推荐使用prometheus-redis-exporter 6.9.0或更新版本 Chart包包含了完整的Kubernetes资源定义 va...
评论