MySQL主从监控配置-Helm部署方案
一、背景简介
生产环境的MySQL监控面临着部署复杂、标签不统一、管理困难等问题。传统方式中每个MySQL实例都需要单独部署一个exporter,部署方式繁琐,采集的指标标签不统一,无法在监控图表上快速检索查看。
本方案采用Helm部署mysql-exporter实现MySQL监控采集,可以灵活增加mysql监控实例,大大简化了运维管理复杂度。
二、部署文件准备
2.1. 必需文件清单
| 文件类型 | 文件名称 | 说明 |
|---|---|---|
| Helm Charts | prometheus-mysql-exporter-2.10.0.tgz |
prometheus-mysql-exporter chart部署包 |
| 配置文件 | mysql-exporter-values.yaml |
mysql-exporter配置文件 |
2.2. 环境要求
- Kubernetes集群环境
- Helm 3.x已安装配置
- Prometheus Operator已部署
- 具备集群管理权限
三、配置步骤
3.1. MySQL监控账号创建
MySQL监控账号用于采集MySQL监控数据,需要具备特定的权限以确保能够获取完整的监控指标。
(1)创建监控用户
CREATE USER 'exporter'@'%' IDENTIFIED BY 'your-secure-password' WITH MAX_USER_CONNECTIONS 3;(2)授权必要权限
GRANT PROCESS, REPLICATION CLIENT, SELECT ON *.* TO 'exporter'@'%';
FLUSH PRIVILEGES;(3)权限说明
| 权限类型 | 用途说明 |
|---|---|
PROCESS |
查看进程列表,获取连接状态信息 |
REPLICATION CLIENT |
获取主从复制状态信息 |
SELECT |
查询performance_schema等系统表 |
3.2. 配置文件修改
修改mysql-exporter-values.yaml配置文件中的关键配置项:
(1)多目标配置结构
serviceMonitor:
  enabled: true
  additionalLabels: {}
  jobLabel: ""
  targetLabels: []
  podTargetLabels: []
  metricRelabelings: []
  relabelings: []

  # 启用多目标采集
  multipleTarget:
    enabled: true
    targets:
    - endpoint: 172.16.1.15
      name: app-db-write-master
      port: 3306
      user: exporter
      password: your-secure-password
    - endpoint: 172.16.1.17
      name: app-db-backup-master
      port: 3306
      user: exporter
      password: your-secure-password

  # 共享认证配置(可选)
  sharedSecret:
    enabled: false
    name: ""
(2)配置参数详解
| 配置项 | 示例值 | 说明 |
|---|---|---|
endpoint |
172.16.1.15 |
MySQL实例的IP地址或域名 注意:使用域名配置多个IP时需使用具体IP避免数据混乱 |
name |
app-db-write-master |
节点标识名称,用于监控页面筛选 命名规范:平台-用途-角色 |
port |
3306 |
MySQL端口,默认3306,可选配置 |
user |
exporter |
监控账号用户名 |
password |
your-secure-password |
监控账号密码 注意:避免使用 #等特殊字符 |
(3)命名规范示例
四、部署实施
4.1. 部署命令
在具备Helm环境的生产服务器上执行部署:
# 部署MySQL监控
helm install prometheus-mysql-exporter \
  prometheus-mysql-exporter-2.10.0.tgz \
  --version 2.10.0 \
  -n monitoring \
  -f mysql-exporter-values.yaml
4.2. 部署验证
(1)检查Pod状态
# 查看Pod状态
kubectl get pods -n monitoring | grep mysql-exporter

# 查看Pod详细信息
kubectl describe pod <mysql-exporter-pod-name> -n monitoring
(2)验证Service和ServiceMonitor
# 查看Service
kubectl get service -n monitoring | grep mysql-exporter

# 查看ServiceMonitor
kubectl get servicemonitor -n monitoring | grep mysql-exporter
(3)验证指标采集
# 端口转发测试
kubectl port-forward service/prometheus-mysql-exporter 9104:9104 -n monitoring

# 访问指标端点
curl http://localhost:9104/metrics
4.3. 安全清理
五、监控配置管理
5.1. 添加新的MySQL实例
(1)获取当前配置
# 导出当前配置
helm get values prometheus-mysql-exporter -n monitoring > current-values.yaml
(2)修改配置添加新实例
# 在targets中添加新的MySQL实例
targets:
- endpoint: 172.16.1.18
  name: app-cluster-write-master
  user: exporter
  password: your-secure-password
(3)更新部署
# 更新Helm部署
helm upgrade prometheus-mysql-exporter \
  prometheus-mysql-exporter-2.10.0.tgz \
  --version 2.10.0 \
  -n monitoring \
  -f current-values.yaml

# 清理临时配置文件
rm current-values.yaml
5.2. 移除MySQL实例
# 导出配置并编辑
helm get values prometheus-mysql-exporter -n monitoring > temp-values.yaml

# 编辑文件移除不需要的targets配置
vim temp-values.yaml

# 应用更新
helm upgrade prometheus-mysql-exporter \
  prometheus-mysql-exporter-2.10.0.tgz \
  --version 2.10.0 \
  -n monitoring \
  -f temp-values.yaml

# 清理文件
rm temp-values.yaml
5.3. 完全卸载
# 卸载Helm部署
helm uninstall prometheus-mysql-exporter -n monitoring

# 清理相关Secret(如果需要)
kubectl delete secret prometheus-mysql-exporter -n monitoring
六、监控指标说明
6.1. 核心MySQL指标
6.2. 告警规则配置
groups:
- name: mysql_alerts
  rules:
  - alert: MySQLDown
    expr: mysql_up == 0
    for: 1m
    labels:
      severity: critical
    annotations:
      summary: "MySQL实例不可用"
      description: "{{ $labels.instance }} MySQL实例已下线"

  - alert: MySQLSlaveLag
    expr: mysql_slave_lag_seconds > 300
    for: 2m
    labels:
      severity: warning
    annotations:
      summary: "MySQL主从延迟过高"
      description: "{{ $labels.instance }} 主从延迟 {{ $value }} 秒"

  - alert: MySQLConnectionsHigh
    expr: mysql_global_status_threads_connected / mysql_global_variables_max_connections > 0.8
    for: 2m
    labels:
      severity: warning
    annotations:
      summary: "MySQL连接数过高"
      description: "{{ $labels.instance }} 连接使用率超过80%"
七、故障排查
7.1. 常见问题
7.2. 日志排查
# 查看exporter日志
kubectl logs -f deployment/prometheus-mysql-exporter -n monitoring

# 查看Prometheus日志
kubectl logs -f prometheus-prometheus-kube-prometheus-prometheus-0 -n monitoring

# 检查ServiceMonitor状态
kubectl describe servicemonitor prometheus-mysql-exporter -n monitoring
总结
通过Helm部署MySQL监控方案具有以下优势:
- 简化部署:一次性配置多个MySQL实例监控
- 统一管理:集中化的配置管理和版本控制
- 安全存储:敏感信息通过Kubernetes Secret安全存储
- 灵活扩展:支持动态添加和移除监控实例
- 标准化:统一的命名规范和标签体系
本方案大大降低了MySQL监控的运维复杂度,提升了监控系统的可维护性和可扩展性。
参考文档
本博客所有文章除特别声明外,均采用 CC BY-NC-SA 4.0 许可协议。转载请注明来源 逐光の博客!
相关推荐
2024-12-30
Redis集群监控配置-Helm部署方案
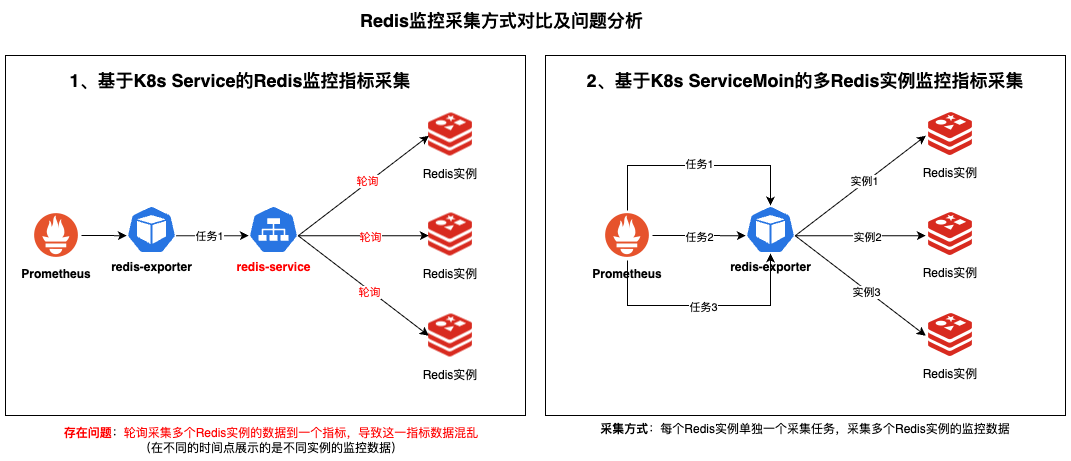
一、背景简介生产环境的Redis监控告警一直存在准确性问题,通过深入排查发现redis-exporter采集方式不正确,导致监控指标偏差和告警误报。为了解决这些问题,采用标准化的Helm部署方式来实现Redis集群监控采集。 核心解决问题: 修复Redis监控指标采集不准确的问题 统一Redis集群监控部署方式 提供安全的认证信息管理 支持多集群的灵活配置管理 本方案通过Helm部署redis-exporter实现Redis集群监控采集,确保监控数据的准确性和可靠性。 二、部署文件准备2.1. 必需文件清单 文件类型 文件名称 说明 Helm Charts prometheus-redis-exporter-6.9.0.tgz prometheus-redis-exporter chart部署包 配置文件 redis-exporter-values.yaml redis-exporter配置文件 版本说明: 推荐使用prometheus-redis-exporter 6.9.0或更新版本 Chart包包含了完整的Kubernetes资源定义 va...

2023-05-06
Kube-Prometheus监控MySQL(二)
一、概述本文介绍如何使用 Kube-Prometheus 监控 MySQL 数据库。通过部署 MySQL Exporter,将 MySQL 的性能指标暴露给 Prometheus 进行采集和监控。 核心组件: MySQL Exporter:用于暴露 MySQL 指标的 Exporter(镜像版本:v0.14.0) ServiceMonitor:Prometheus Operator 的 CRD,用于服务发现和指标采集配置 二、部署 MySQL Exporter2.1 创建 Deployment通过 Deployment 部署 MySQL Exporter,需要配置数据库连接信息。 apiVersion: apps/v1 kind: Deployment metadata: #设置唯一名称,建议添加数据库实例ip name: mysql-exporter-172.16.1.77 namespace: monitoring labels: app.kubernetes.io/component: exporter app.kubernetes....

2023-05-07
Kube-Prometheus监控Redis(三)
一、概述本文介绍如何使用 Kube-Prometheus 监控 Redis。通过部署 Redis Exporter,将 Redis 的性能指标暴露给 Prometheus 进行采集和监控。 核心组件: Redis Exporter:用于暴露 Redis 指标的 Exporter(镜像版本:v1.37.0) ServiceMonitor:Prometheus Operator 的 CRD,用于服务发现和指标采集配置 二、部署 Redis Exporter2.1 创建 Deployment通过 Deployment 部署 Redis Exporter,需要配置 Redis 连接信息。 apiVersion: apps/v1 kind: Deployment metadata: #设置唯一名称,建议添加数据库实例ip name: redis-exporter-172.16.1.77 namespace: monitoring labels: app.kubernetes.io/component: exporter app.kubernetes.i...

2021-12-20
Linux服务器重启后mysqld.service未创建/var/run/mysqld
一、问题背景开发环境的数据库服务器重启后,启动MySQl服务报错,错误如下: [ERROR] /usr/sbin/mysqld: Can't create/write to file '/var/run/mysqld/mysqld.pid' (Errcode: 2 - No such file or directory) [ERROR] Can't start server: can't create PID file: No such file or directory 之前看到上面错误日志都是手动创建/var/run/mysqld目录,然后将目录的属主修改为mysql用户,如下: mkdir -p /var/run/mysqld chown mysql:mysql /var/run/mysqld 上面方式,每次服务器重启后都要重新执行,所以分析一下问题原因,探索一种永久的解决方案。 MySQL版本...
2026-03-04
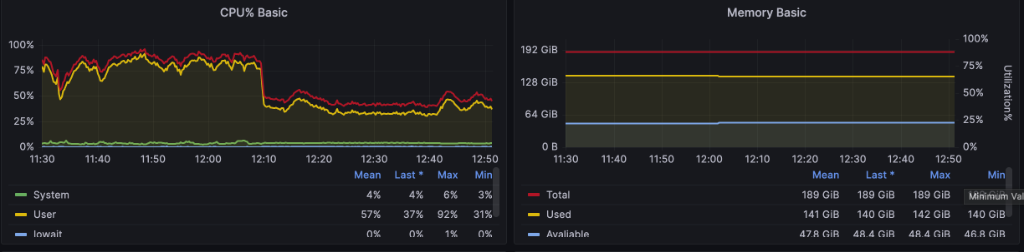
一次生产数据库CPU高占问题排查处理
背景与现象业务侧报警提示数据库 CPU 持续飙高(User 态接近 80%-90%),内存平稳无异常,磁盘 iowait 低。观察监控后确认在 11:30-12:05 期间 CPU 居高不下。 快速定位首先排除系统层 I/O 或内核问题,转向 MySQL 层确认 InnoDB 事务与锁等待情况: SELECT t.`trx_mysql_thread_id`, t.trx_id, t.trx_state, t.trx_started, t.trx_query FROM information_schema.innodb_trx t ORDER BY t.trx_started ASC LIMIT 5; 查询显示存在一个明显的长事务(trx_state=RUNNING,trx_started 很早): 从截图可见该事务在 2026-03-04 04:58:07 就已开始,且 trx_query 为 NULL,结合现场判断为空闲但未提交的“长事务”(Idle in transaction)。通过 SHOW PROCESSLIS...

2019-07-02
MySQL插入速度测试
一、测试环境1.1 硬件环境 名称 配置 操作系统 win7 64位 CPU 4核4线程 i5-4590 内存 16G 硬盘 128G SSD MySQL Version 5.6 1.2 数据库表结构CREATE TABLE `user` ( `id` int(11) NOT NULL AUTO_INCREMENT, `username` varchar(50) DEFAULT NULL, `password` varchar(50) DEFAULT NULL, `sex` int(11) DEFAULT NULL, `phone` varchar(20) DEFAULT NULL, `email` varchar(50) DEFAULT NULL, `remark` varchar(255) DEFAULT NULL, PRIMARY KEY (`id`) ) ENGINE=InnoDB AUTO_INCREMENT=0 DEFAULT CHARSET=utf8; 二、插入实验2.1 普通插入 线程数 插入量(...
评论